Mean Absolute Error (MAE)
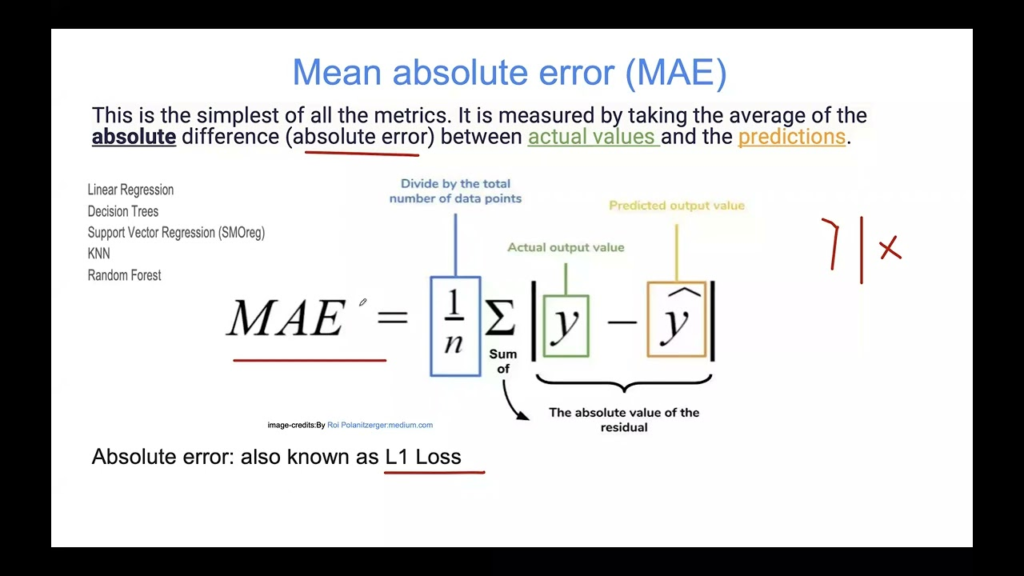
Mean Absolute Error (MAE) is a fundamental metric in machine learning for evaluating regression models. It measures the average magnitude of errors in predictio...
6 min read
MAE
Regression
+3
Adjusted R-squared is a statistical measure used to evaluate the goodness of fit of a regression model, accounting for the number of predictors to avoid overfitting and provide a more accurate assessment of model performance.
Adjusted R-squared evaluates regression model fit, adjusting for predictors to avoid overfitting. Unlike R-squared, it only increases with significant predictors. Essential in regression analysis, it aids in model selection and performance evaluation in fields like finance.
Adjusted R-squared is a statistical measure used to evaluate the goodness of fit of a regression model. It is a modified version of the R-squared (or coefficient of determination) that accounts for the number of predictors in the model. Unlike R-squared, which can artificially inflate with the addition of more independent variables, Adjusted R-squared adjusts for the number of predictors, providing a more accurate measure of a model’s explanatory power. It increases only if the new predictor improves the model’s predictive power more than expected by chance, and decreases when a predictor is not adding significant value.
The formula for Adjusted R-squared is:
[ \text{Adjusted } R^2 = 1 – \left( \frac{1-R^2}{n-k-1} \right) \times (n-1) ]
Where:
Adjusted R-squared is crucial in regression analysis, especially when dealing with multiple regression models, where several independent variables are included. It helps to determine which variables contribute meaningful information and which do not. This becomes particularly important in fields like finance, economics, and data science where predictive modeling is key.
One of the main advantages of Adjusted R-squared is its ability to penalize the addition of non-significant predictors. Adding more variables to a regression model typically increases the R-squared due to the likelihood of capturing random noise. However, Adjusted R-squared will only increase if the added variable improves the model’s predictive power, thereby avoiding overfitting.
Start your free trial today and see results within days.
In machine learning, Adjusted R-squared is employed to evaluate the performance of regression models. It is particularly useful in feature selection, which is an integral part of model optimization. By using Adjusted R-squared, data scientists can ensure that only those features that genuinely contribute to the model’s accuracy are included.
In finance, Adjusted R-squared is often used to compare the performance of investment portfolios against a benchmark index. By adjusting for the number of variables, investors can better understand how well a portfolio’s returns are explained by various economic factors.
Consider a model predicting house prices based on square footage and the number of bedrooms. Initially, the model shows a high R-squared value, suggesting a good fit. However, when additional irrelevant variables, such as the color of the front door, are added, the R-squared may remain high. Adjusted R-squared would decrease in this scenario, indicating that the new variables do not improve the model’s predictive power.
According to a guide from the Corporate Finance Institute, consider two regression models for predicting the price of a pizza. The first model uses the price of dough as the sole input variable, yielding an R-squared of 0.9557 and an adjusted R-squared of 0.9493. A second model adds temperature as a second input variable, yielding an R-squared of 0.9573 but a lower adjusted R-squared of 0.9431. The adjusted R-squared correctly indicates that temperature does not improve the model’s predictive power, guiding analysts to prefer the first model.
While both R-squared and Adjusted R-squared serve to measure the goodness of fit for a model, they are not interchangeable and serve different purposes. R-squared may be more appropriate for simple linear regression with a single independent variable, while Adjusted R-squared is better suited for multiple regression models with several predictors.
Leverage FlowHunt’s AI tools to build, test, and optimize regression models with advanced metrics like Adjusted R-squared.
Mean Absolute Error (MAE) is a fundamental metric in machine learning for evaluating regression models. It measures the average magnitude of errors in predictio...

Random Forest Regression is a powerful machine learning algorithm used for predictive analytics. It constructs multiple decision trees and averages their output...
Linear regression is a cornerstone analytical technique in statistics and machine learning, modeling the relationship between dependent and independent variable...
Cookie Consent
We use cookies to enhance your browsing experience and analyze our traffic. See our privacy policy.